Translations of this page?:
- Deutsch (de)
- English (en)
The annual electricity bill can be surprising if, for example, you are a single household with over 3500KWh. Switching providers may also help to reduce costs, but of course it is better to reduce consumption. But how do you get consumption without using an ammeter behind every device?
One method is to build a three-phase energy meter directly into the fuse box. Among other things, you can get here inexpensive versions for less than 50 €,
The trusted electrician will help with the installation in the fuse box if you don't trust yourself to do it.
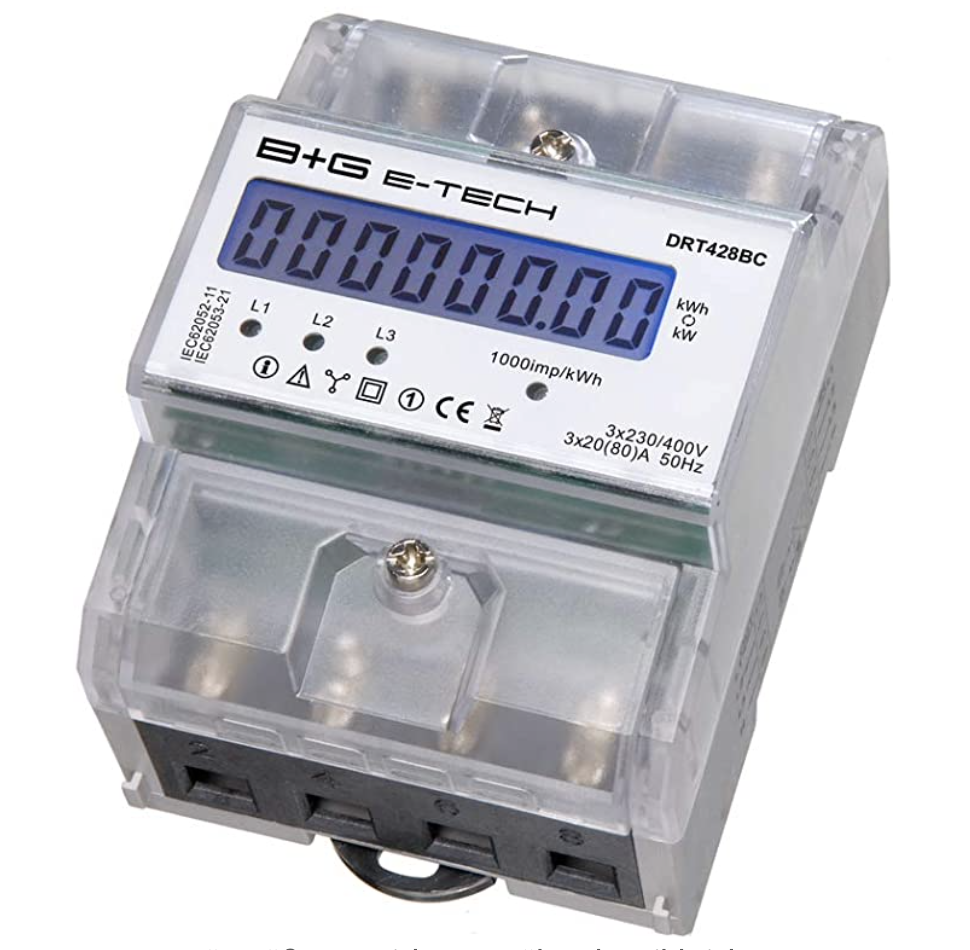
The one I have selected shows the current and accumulated power consumption summed up for all phases. What many of these electronic electricity meters have in common is that they also output the current consumption via a potential-free S0 interface (not to be confused with an ISDN S0 bus). Wikipedia explains how it works. If you want to record the delivered values and evaluate them later, you need a data logger. In the following I will present my solution.
The first task is to investigate into the S0 interface and then make it available for evaluation in our home WiFi. Let's take a look at the S0 signal, which comes from a three-phase meter:
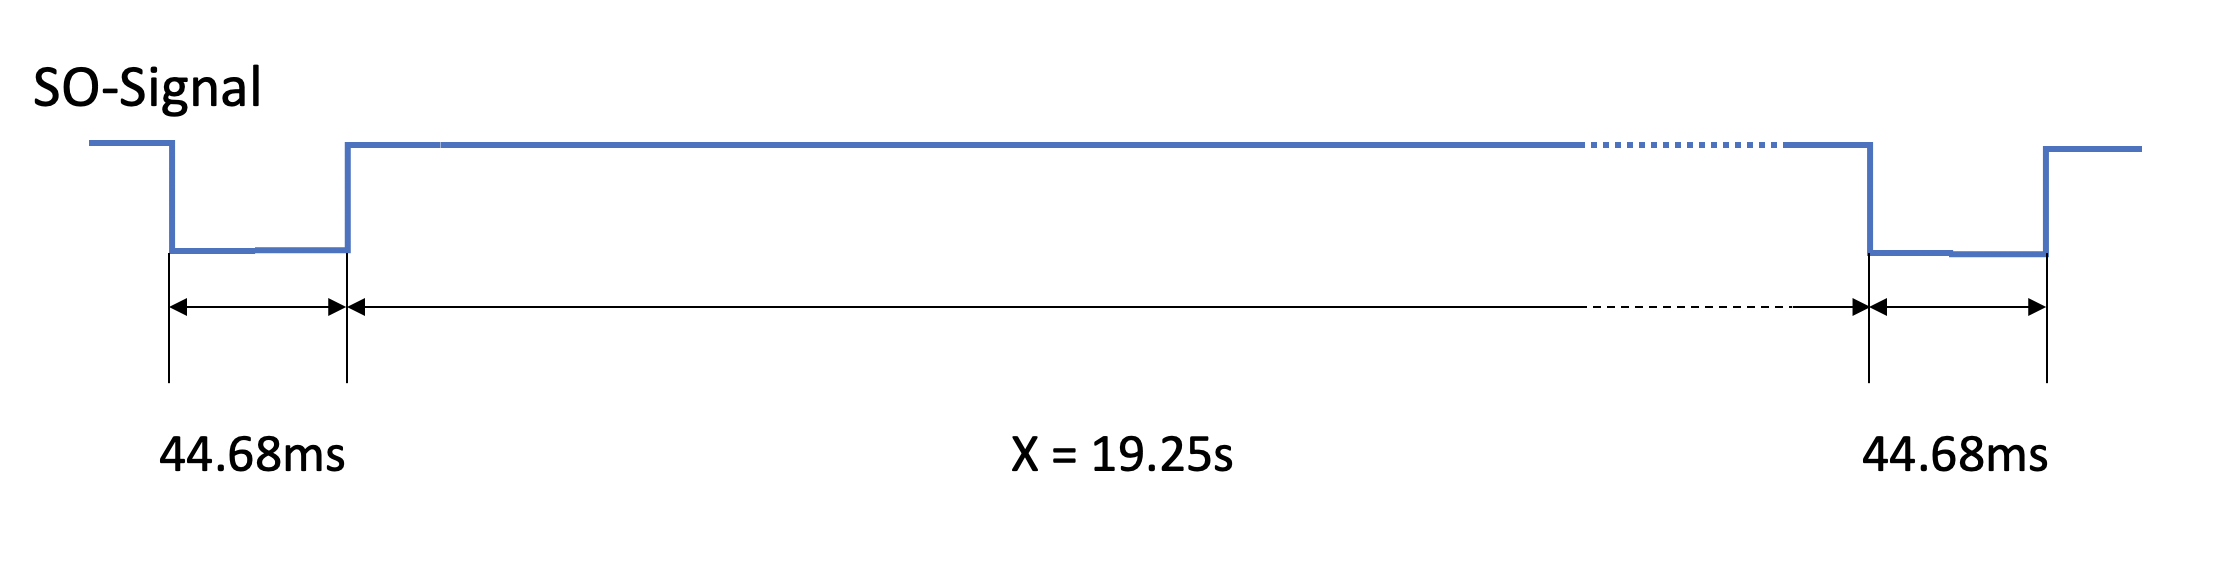
There are pulses of approx. 44ms and the interval between the pulses reflects the current consumption. In the example it is 19.25 seconds. According to the device specification, we can expect 1000imp / KWh. This is also noted on the front of the meter. This results in the calculation formula for the consumption of:
W [Watt] = 3600 / X [sec]
W = 3600 / 19.25 = 187 watt
To determine the consumption, we therefore need a time measurement with min of tenths of a second resolution.
If you want to use WiFi with your own projects, it is always advisable to first take a look at the ESP8266 modules.

One of the simplest approaches is an ESP-07 with the open source firmware ESP Easy. In fact, we can manage to implement the above task without our own programming.
But first let's fix the electrical and mechanical structure. The circuit diagram is very clear and is similar to the bed sensor project here elsewhere. The circuit has three S0 inputs if you want to evaluate the phases individually. I only used one in my installation because you already know that I get the total consumption delivered.
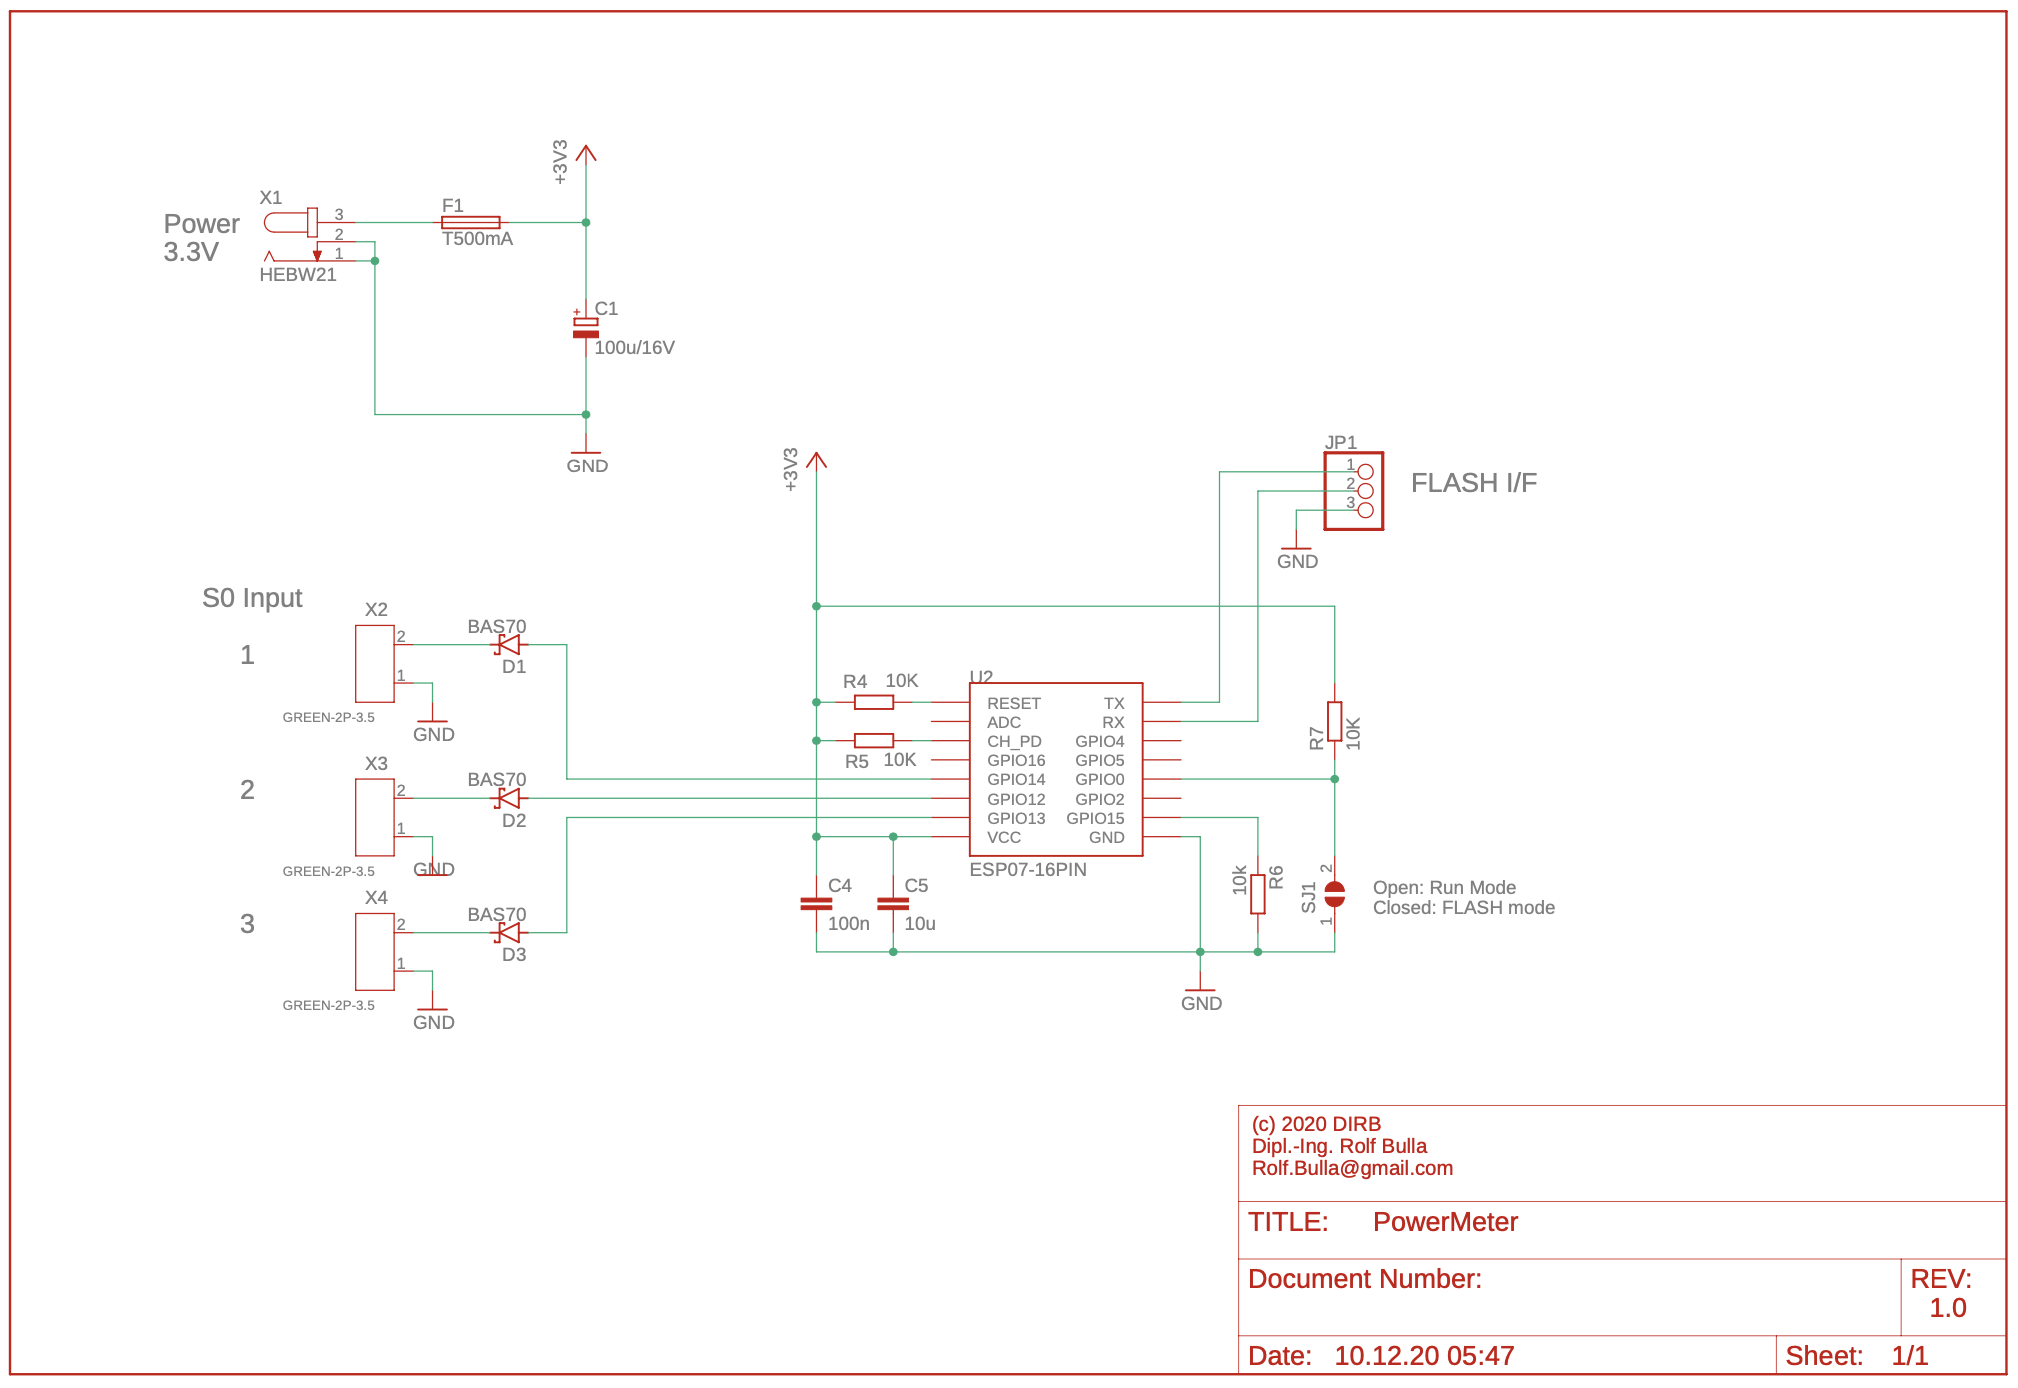
The internal pull-ups supply the optocoupler of the three-phase meter, so the impulse can be recognized at the respective pins. The diodes D1-D3 are only used to protect against polarity reversal and are not absolutely necessary. Of course, the S0 lines can also be connected directly to the module, thus avoiding the PCB with free wiring. For my solution, however, I created a PCB.
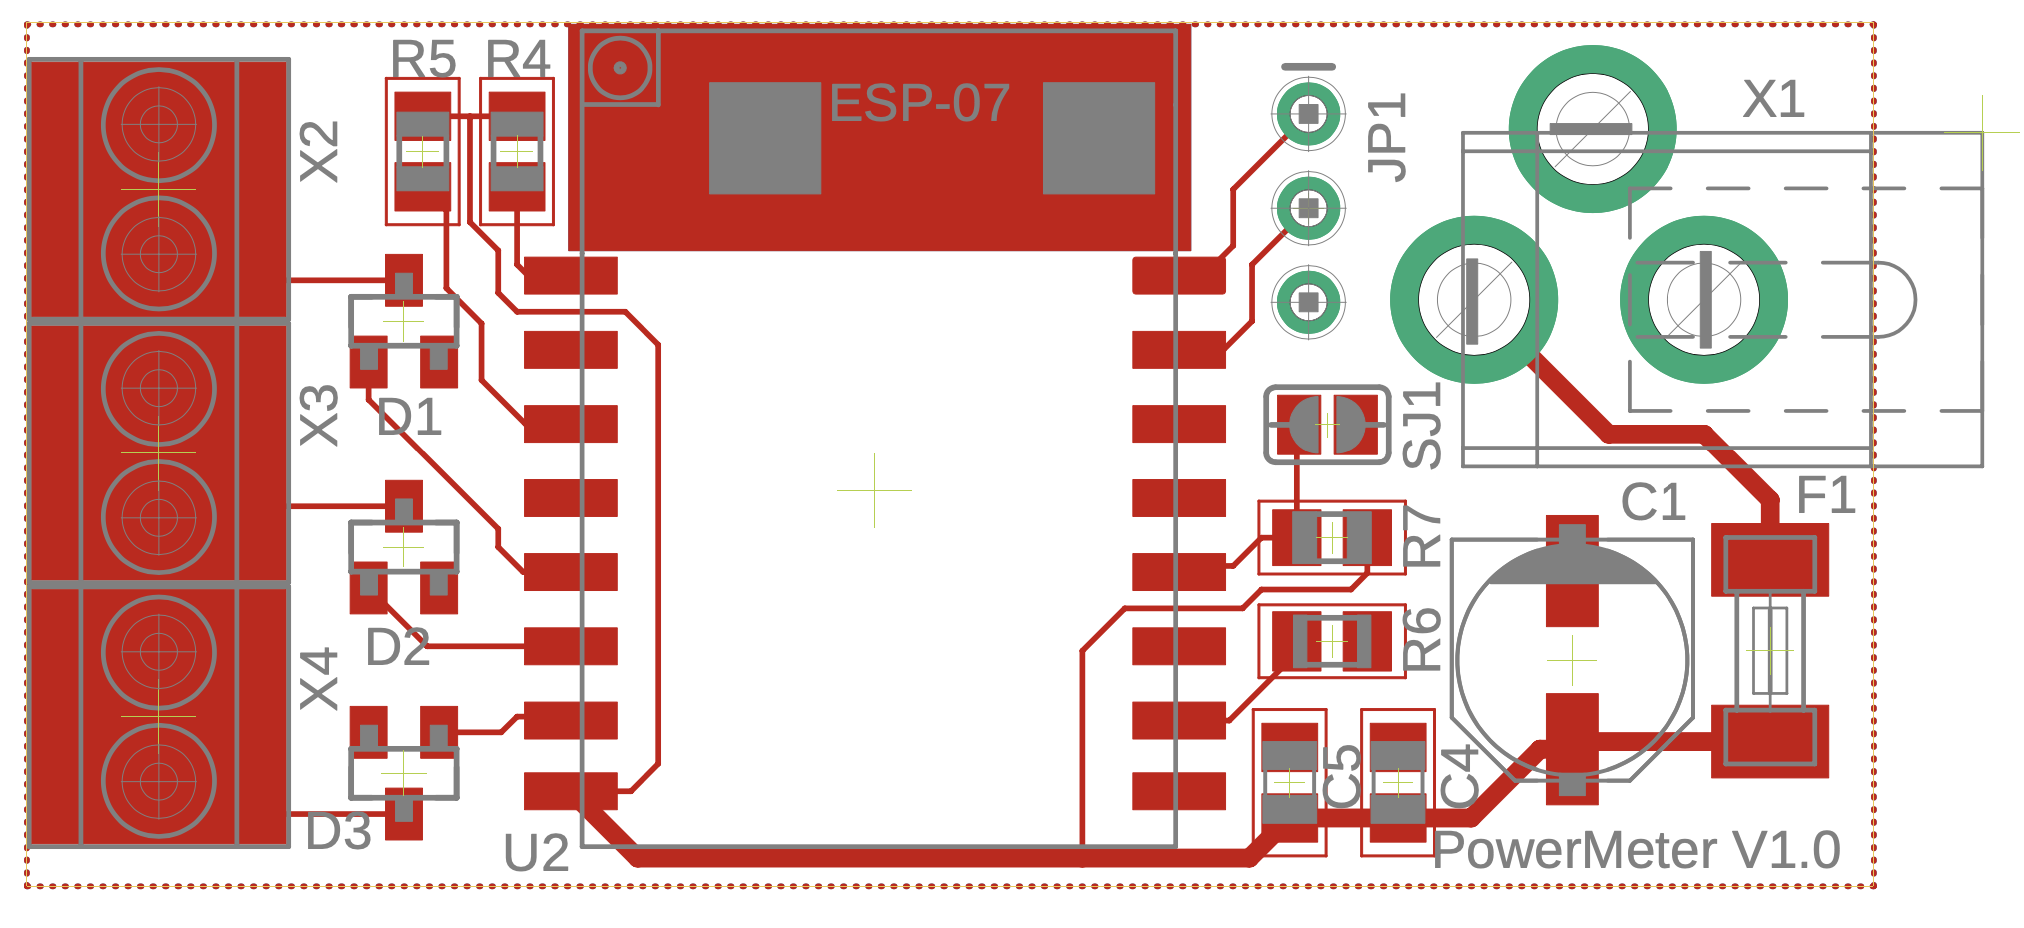
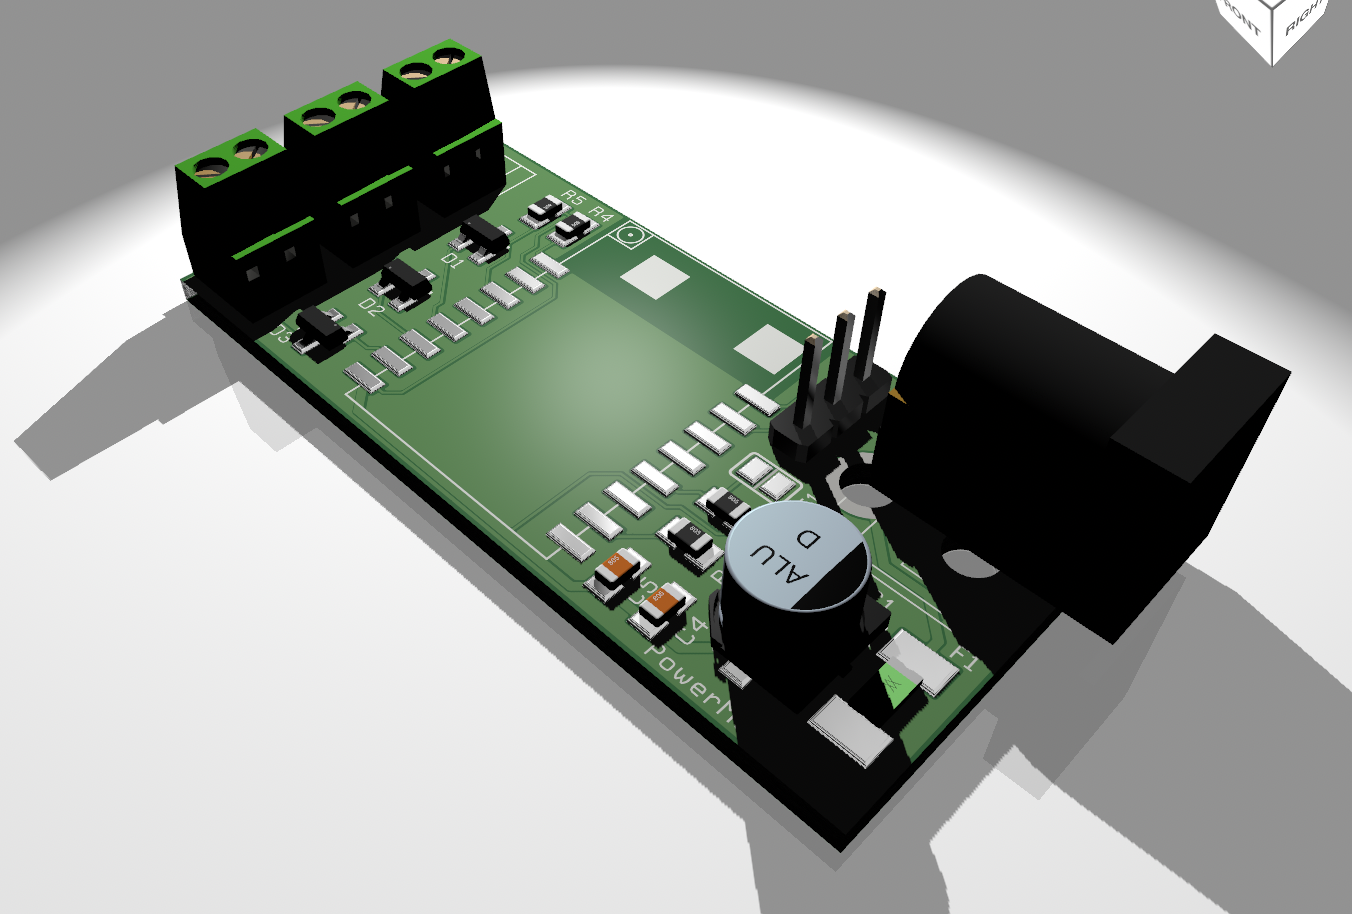
The S0 lines are connected using screw terminals. The power supply can also be plugged in with a 5.5 / 2.1mm socket. For this you can find very inexpensive plug-in power supplies with a stabilized 3.3V DC voltage output. The PowerMeter does not need more wired connectivity.
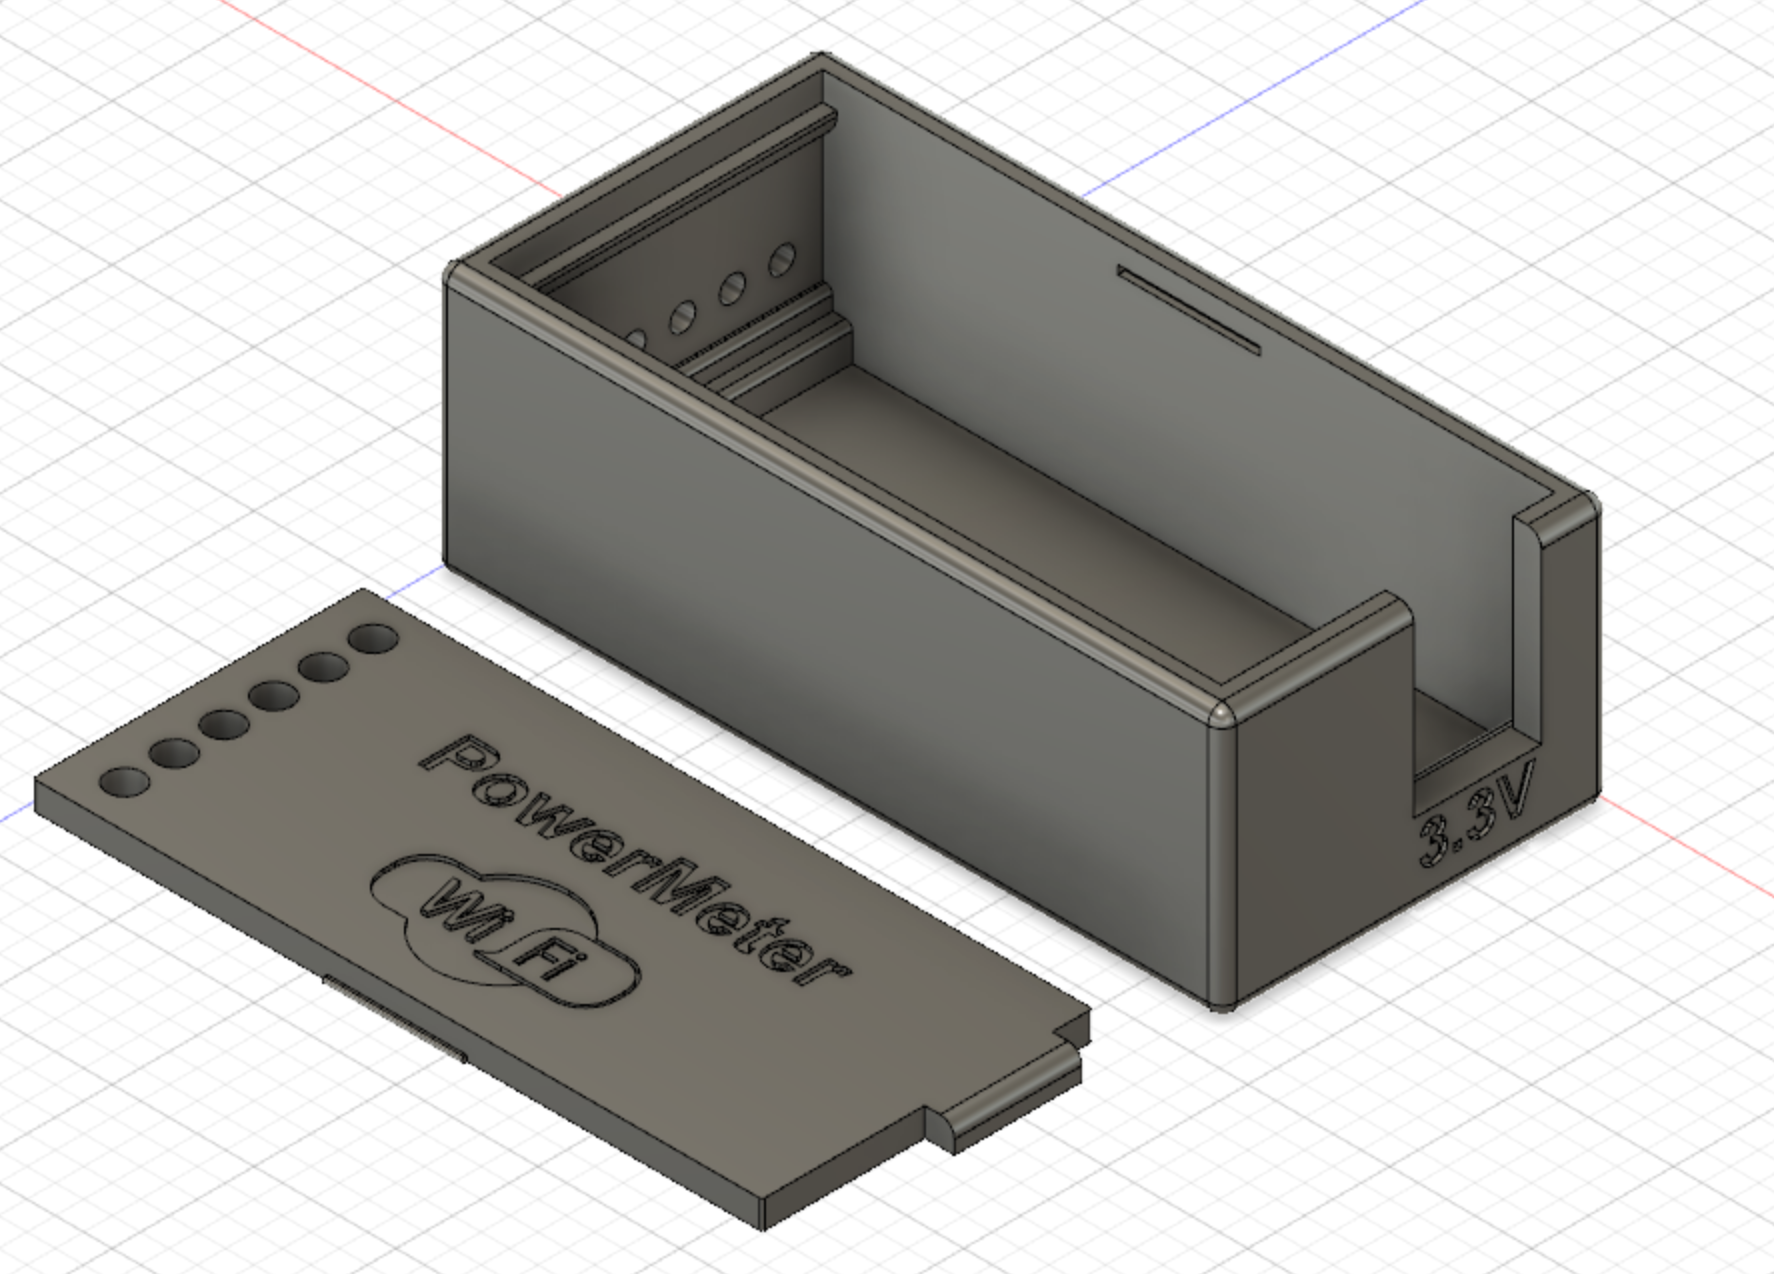
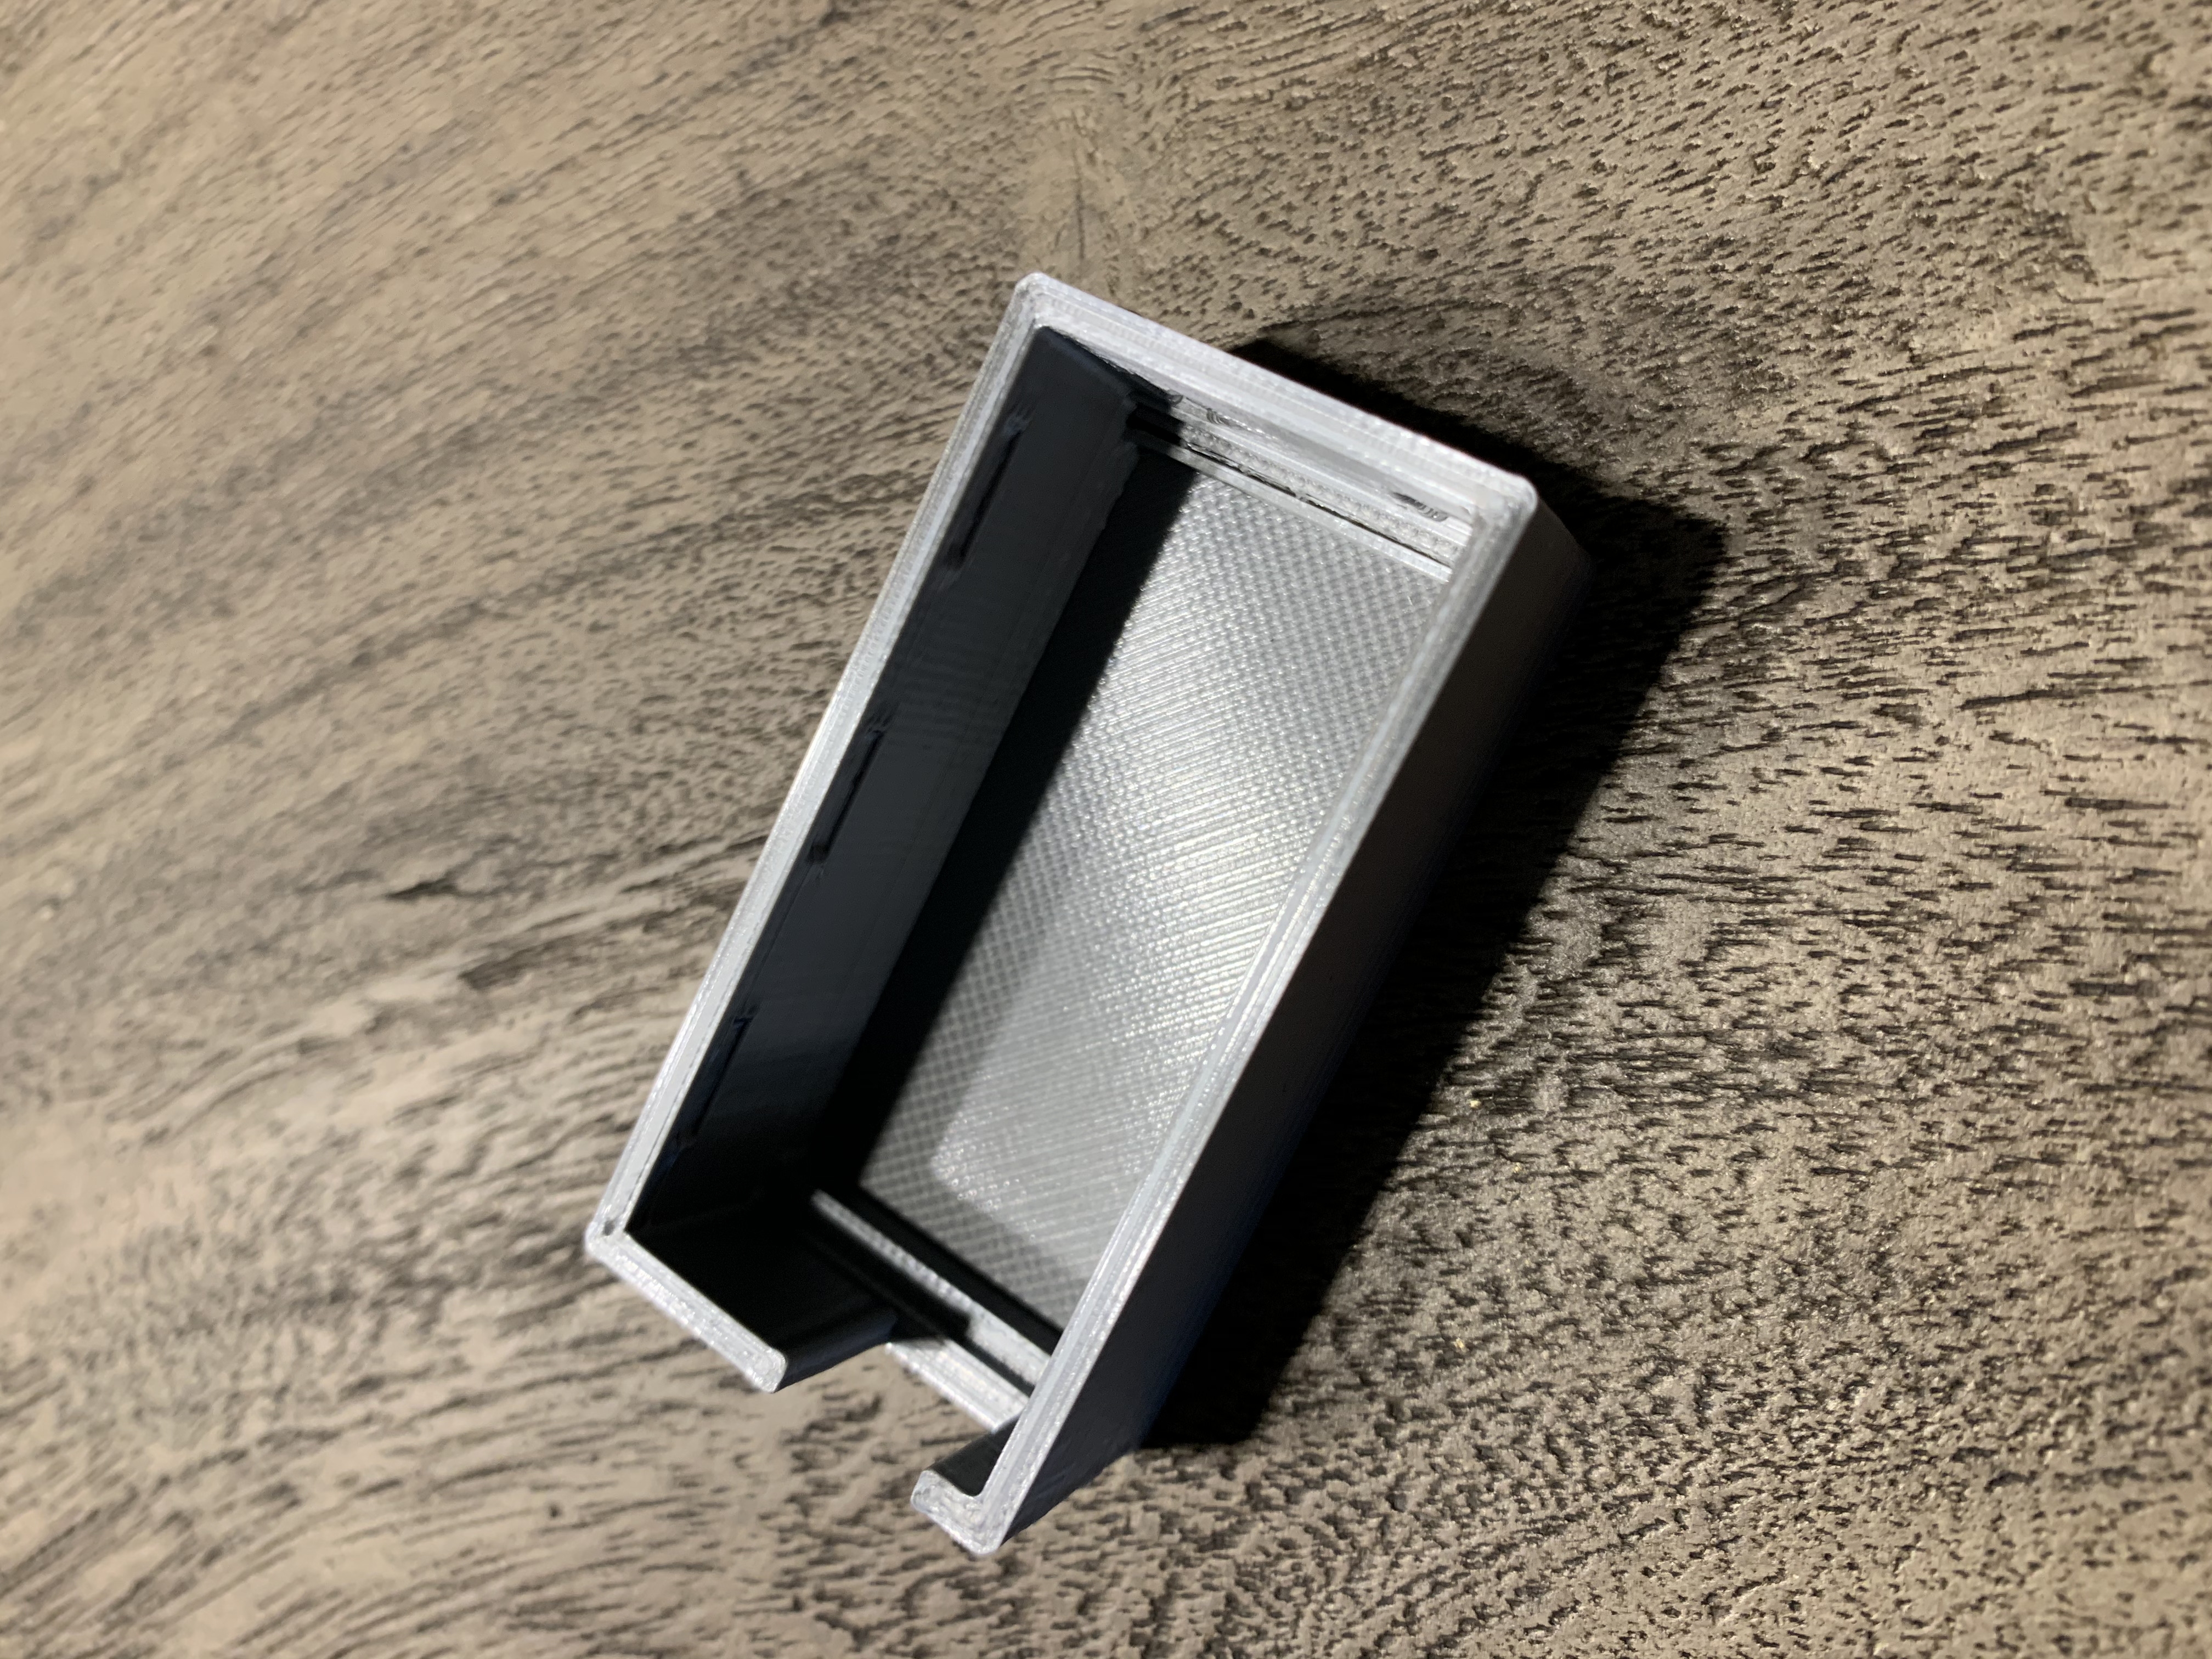
With a 3D printer, an inconspicuous housing can be realized which can easily be attached with double-sided adhesive tape outside the fuse box.
After the hardware has been created, we still have to program the ESP module. As already mentioned, the PowerMeter is based on ESPEasy. In the link you can also find instructions on how the ESPEasy firmware is installed on the module. In order to get into the programming mode, the jumper SJ1 must be closed during the reset release. The programming is done serially via JP1 (USB-serial converter).
If everything went well and the module is integrated in the home WiFi, all further settings can be made via the web interface. For this we need:
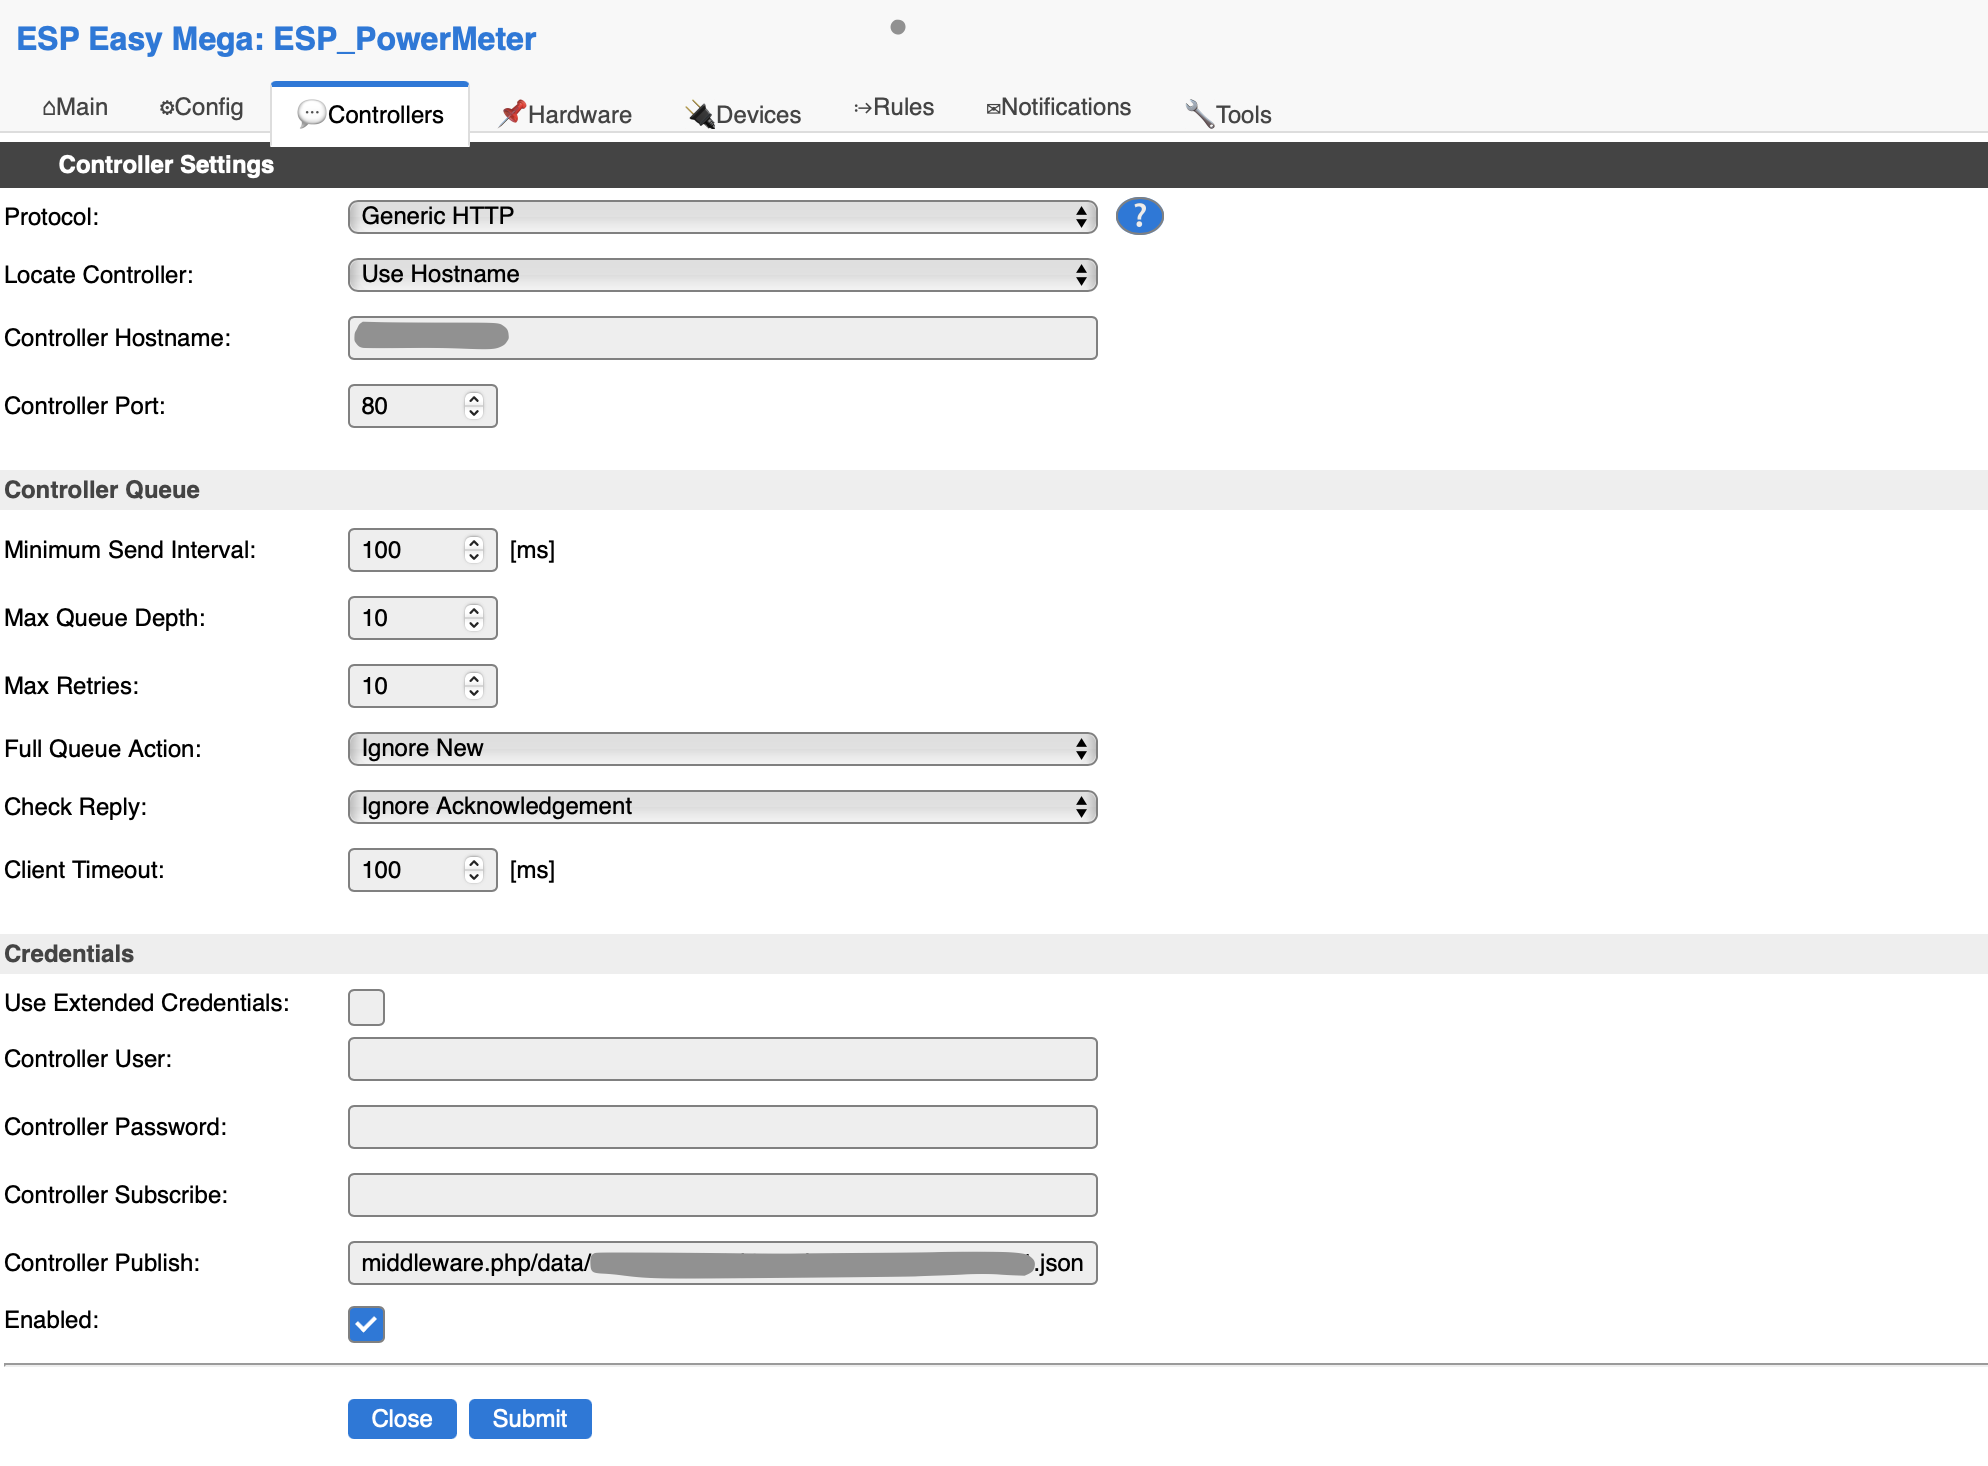
In my case, I send the data to my Volkszähler for recording and evaluation. This is done as JSON format over HTTP. That's why I need an HTTP controller.
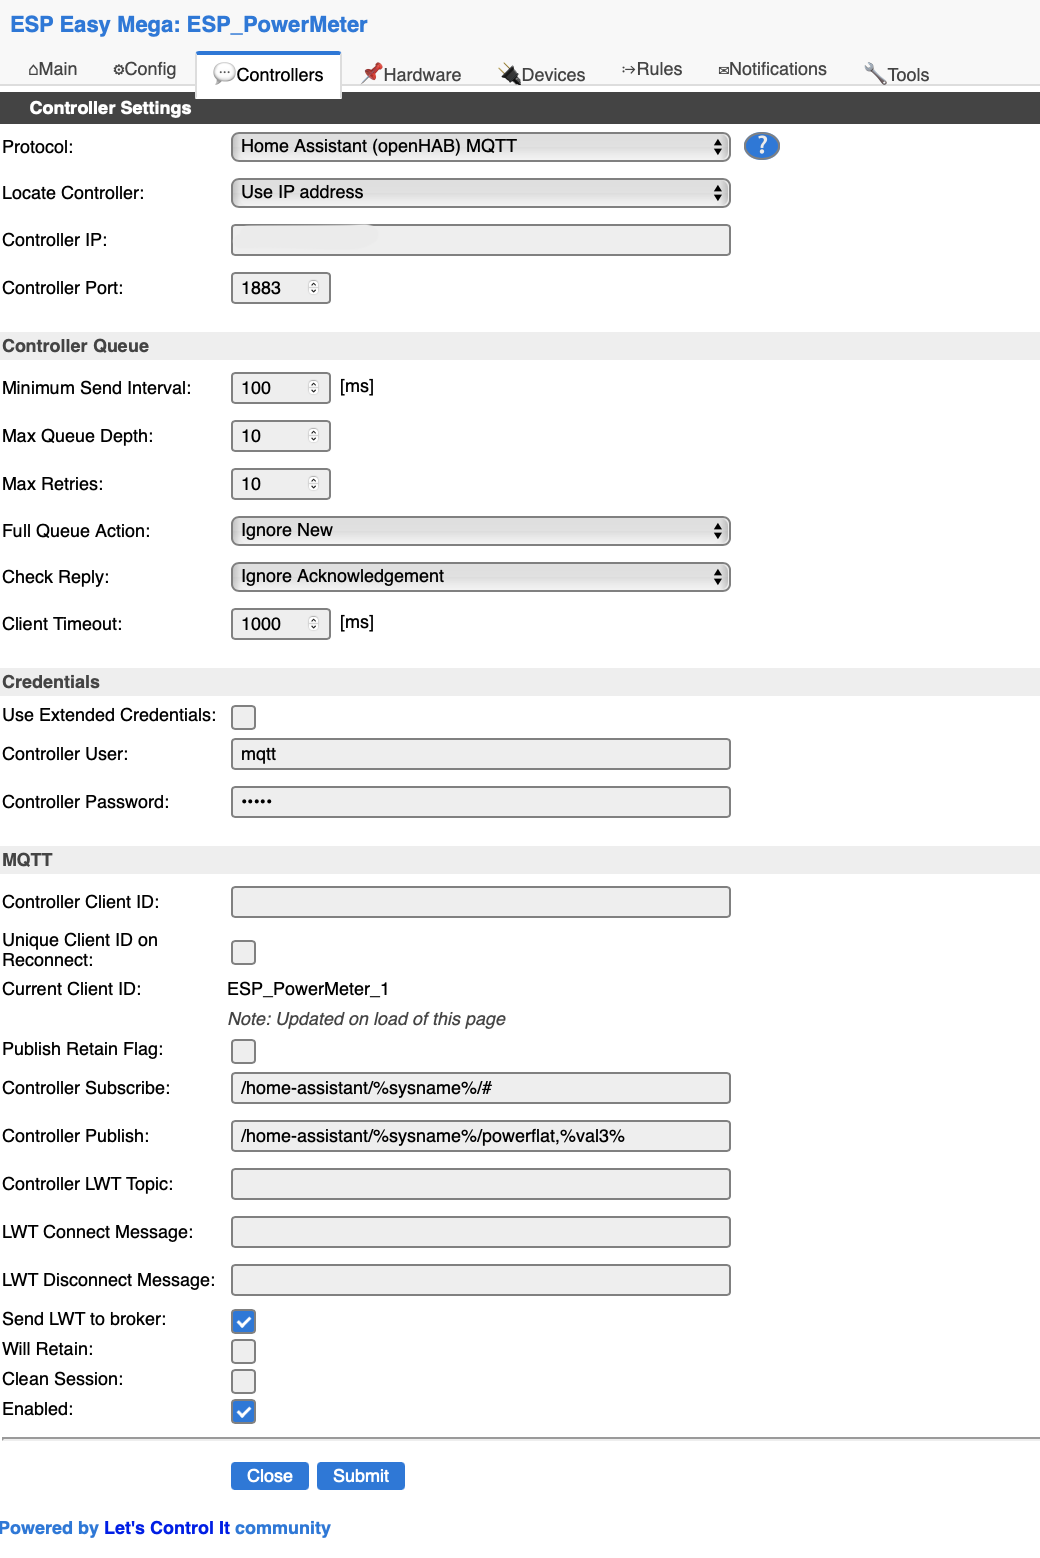
In order to display the current consumption value on a panel (I use Home Assistant), for example, the value can also be transferred via MQTT. This is what the MQTT controller is for.
The gray areas are the anonymization of the host and the UUID of the Volkszähler. Then simply enter your own values there. Of course you can also send any other format. You get the value with % val3% . The complete line at Publish looks like this for me:
middleware.php/data/<uuid>.json?operation=add&value=%val3%
Now we select MQTT and enter the relevant data. This includes the IP address of the MQTT server and the account data for logging in. The result should look similar to the following example. Here only the IP of the own MQTT server is anonymized and must be adapted accordingly.
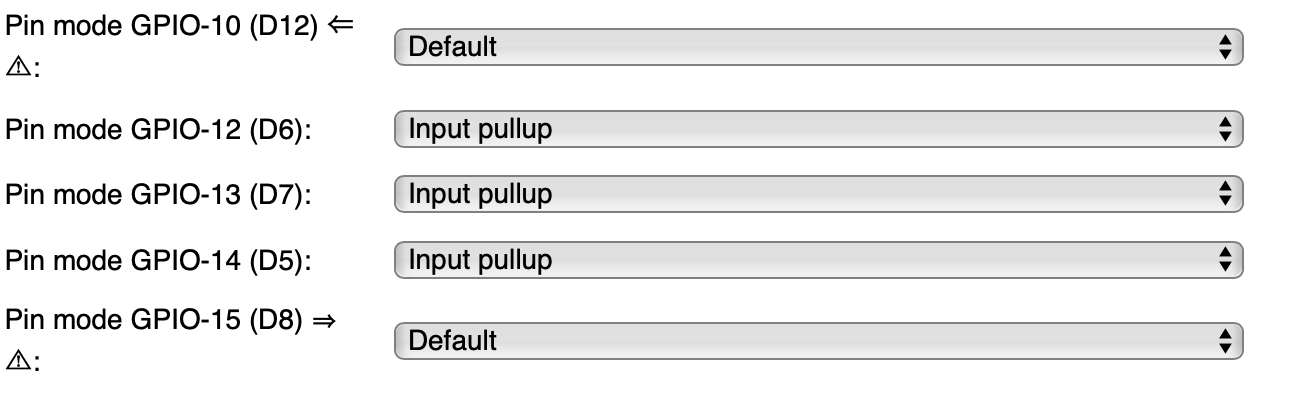
On this tab we only have to switch on the pull-ups at the inputs used.
Next we need a device that measures and stores the time between pulses. This can be achieved via the Devices tab. A separate device is required for each S0 input. Here is just one input shown in my solution.

Incidentally, the green numbers on the right indicate the current measured values. In the example, the time is 25991ms, which corresponds to a consumption of 138.5 watts. Here are the settings for the pulse counter:

Now we have a connection to the MQTT server and we can determine the consumption. What is missing is the flow control for MQTT. There are rules for this within ESPEasy: To do this, copy the following code into rules set 1.
On S0Pulse#Time do
  publish /home-assistant/%sysname%/powerflat,[S0Pulse#Time]
endon
The calculated result is sent to the MQTT server at each completed measurement interval.
The PowerMeter can also easily be integrated with help of ESPHome into Home Assistant. The sample code for one phase you will find here:
esphome:
  name: powermeter

esp8266:
  board: esp01_1m

# Enable logging
logger:

# Enable Home Assistant API
api:
  encryption:
    key: "---key---"

ota:
  password: "---password---"

wifi:
  ssid: !secret wifi_ssid
  password: !secret wifi_password

  # Enable fallback hotspot (captive portal) in case wifi connection fails
  ap:
    ssid: "Powermeter Fallback Hotspot"
    password: "--password--"

captive_portal:

time:
  - platform: sntp
    id: my_time

sensor:
  - platform: pulse_counter
    pin:
      number: GPIO14
      inverted: true
      mode:
        input: true
        pullup: true
    unit_of_measurement: 'kW'
    name: 'Power Meter Flat'
    id: powermeter_flat
    internal_filter: 10us
    filters:
      - multiply: 0.06  # (60s/1000 pulses per kWh)

  - platform: total_daily_energy
    name: "Total Daily Energy"
    power_id: powermeter_flat
Instead of measuring the time between two pulses the number of pulse per time interval is counted.
The PowerMeter is running more than a year now without any problems and is transmitting the data. A typical consumption curve looks like this (screen shot from my own //Volkszähler//):
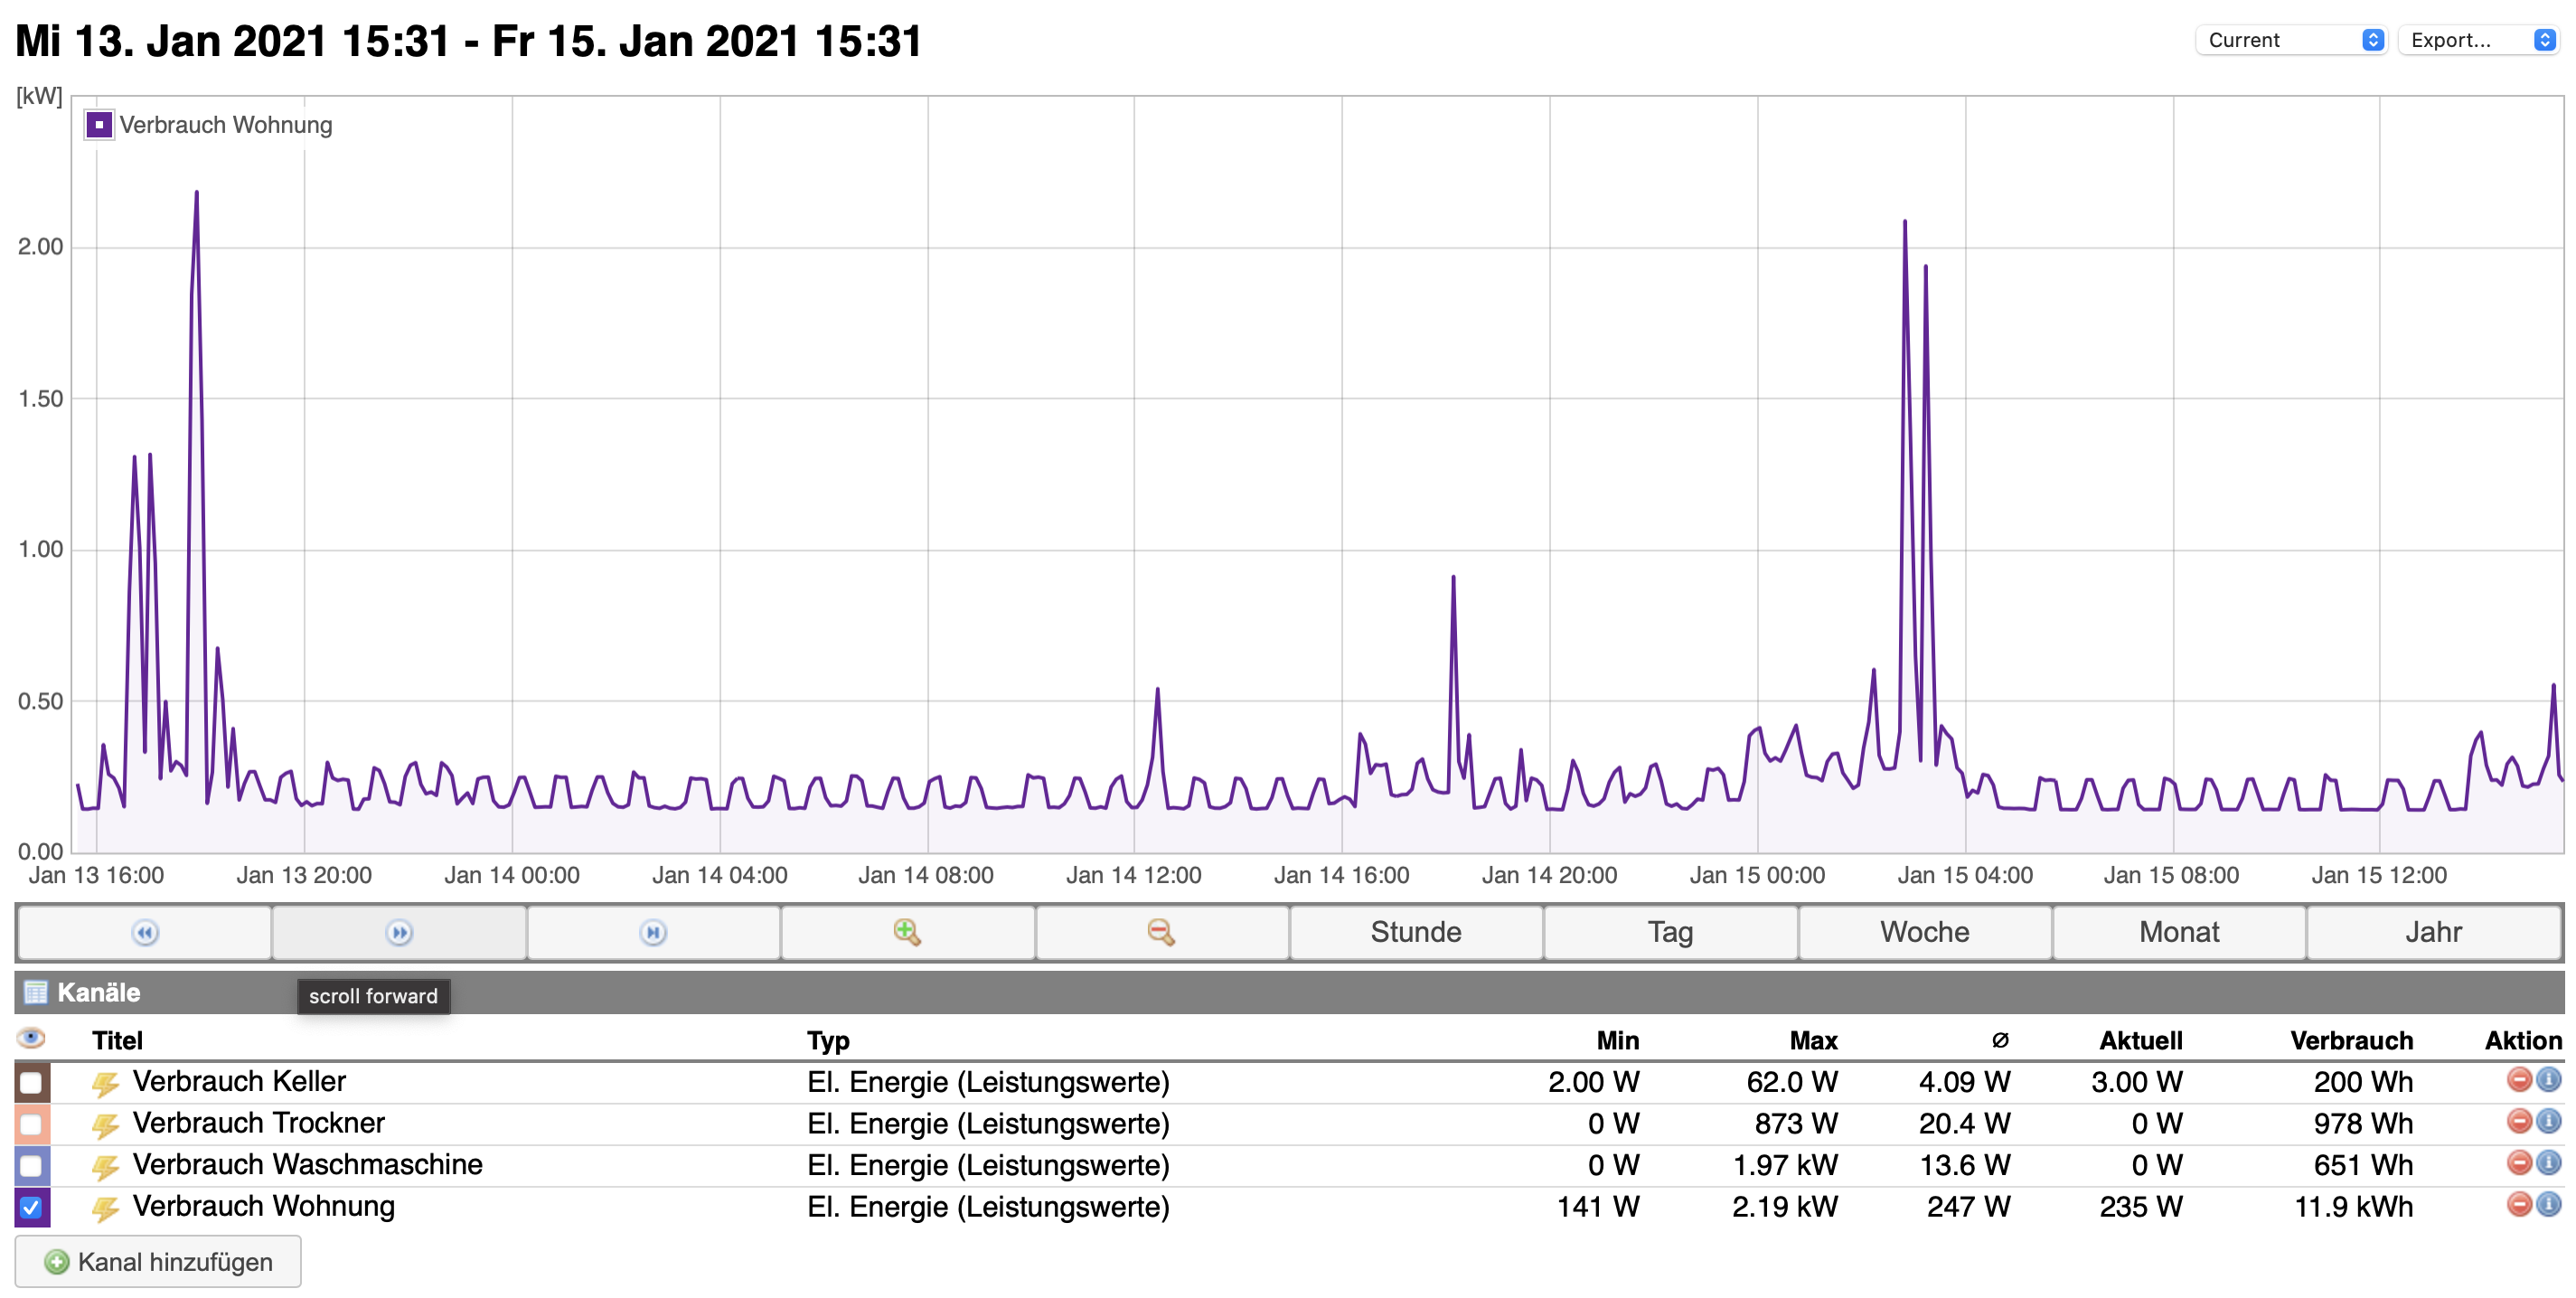
The peaks include the oven, stove and kettle. The regular pulses come from the fridge/freezer equipment. My base load is 150 watts and is certainly also due to the automation.
If you like my articles feel to donate a cappuccino or so…
